Home Products Blog Contact Catalog Company 0216 364 02 10
MeasureSphere Ready-to-Use Industry 4.0 Platform - measuresphere-banner-5-en.webp

MeasureSphere Ready-to-Use Industry 4.0 Platform

FROM IDEA TO A WORKING SYSTEM

Do not start a software project.
Build the application you need.

MeasureSphere is an Industry 4.0 and IIoT application platform that brings together the functions needed in industrial facilities, from field data acquisition to calculations, data logging, dashboard and process screen design, alarm management and reporting, in a single web-based platform.

Use real-time data obtained from OPC UA, Modbus, Siemens S7, MQTT and similar data sources; generate new information with ready-to-use functions, define your logging rules, design your web-based user screens and create the reports you need.

THE MAIN DIFFERENCE IS THIS:
MeasureSphere is not just monitoring software with ready-made screens. It is designed so that plant engineers and system integrators can create the application they need much faster without going through custom software development processes.
 
DO NOT DEVELOP SOFTWARE
Use the ready-made infrastructure.
 
DESIGN WHAT YOU NEED
Your data, your calculations, your screens.
 
COMMISSION FASTER
Spend your time on the application, not the infrastructure.
ONE PLATFORM

MeasureSphere is designed not only to collect field data, but also to process, record, visualize, report and, when necessary, share it with other systems. It helps you create the digital applications you need in your facility much faster on a single platform.

From dashboard screens to process views, from data logging infrastructure to reporting, and from ready-to-use functions to user screen design, it brings together the tools you need within a single workflow.
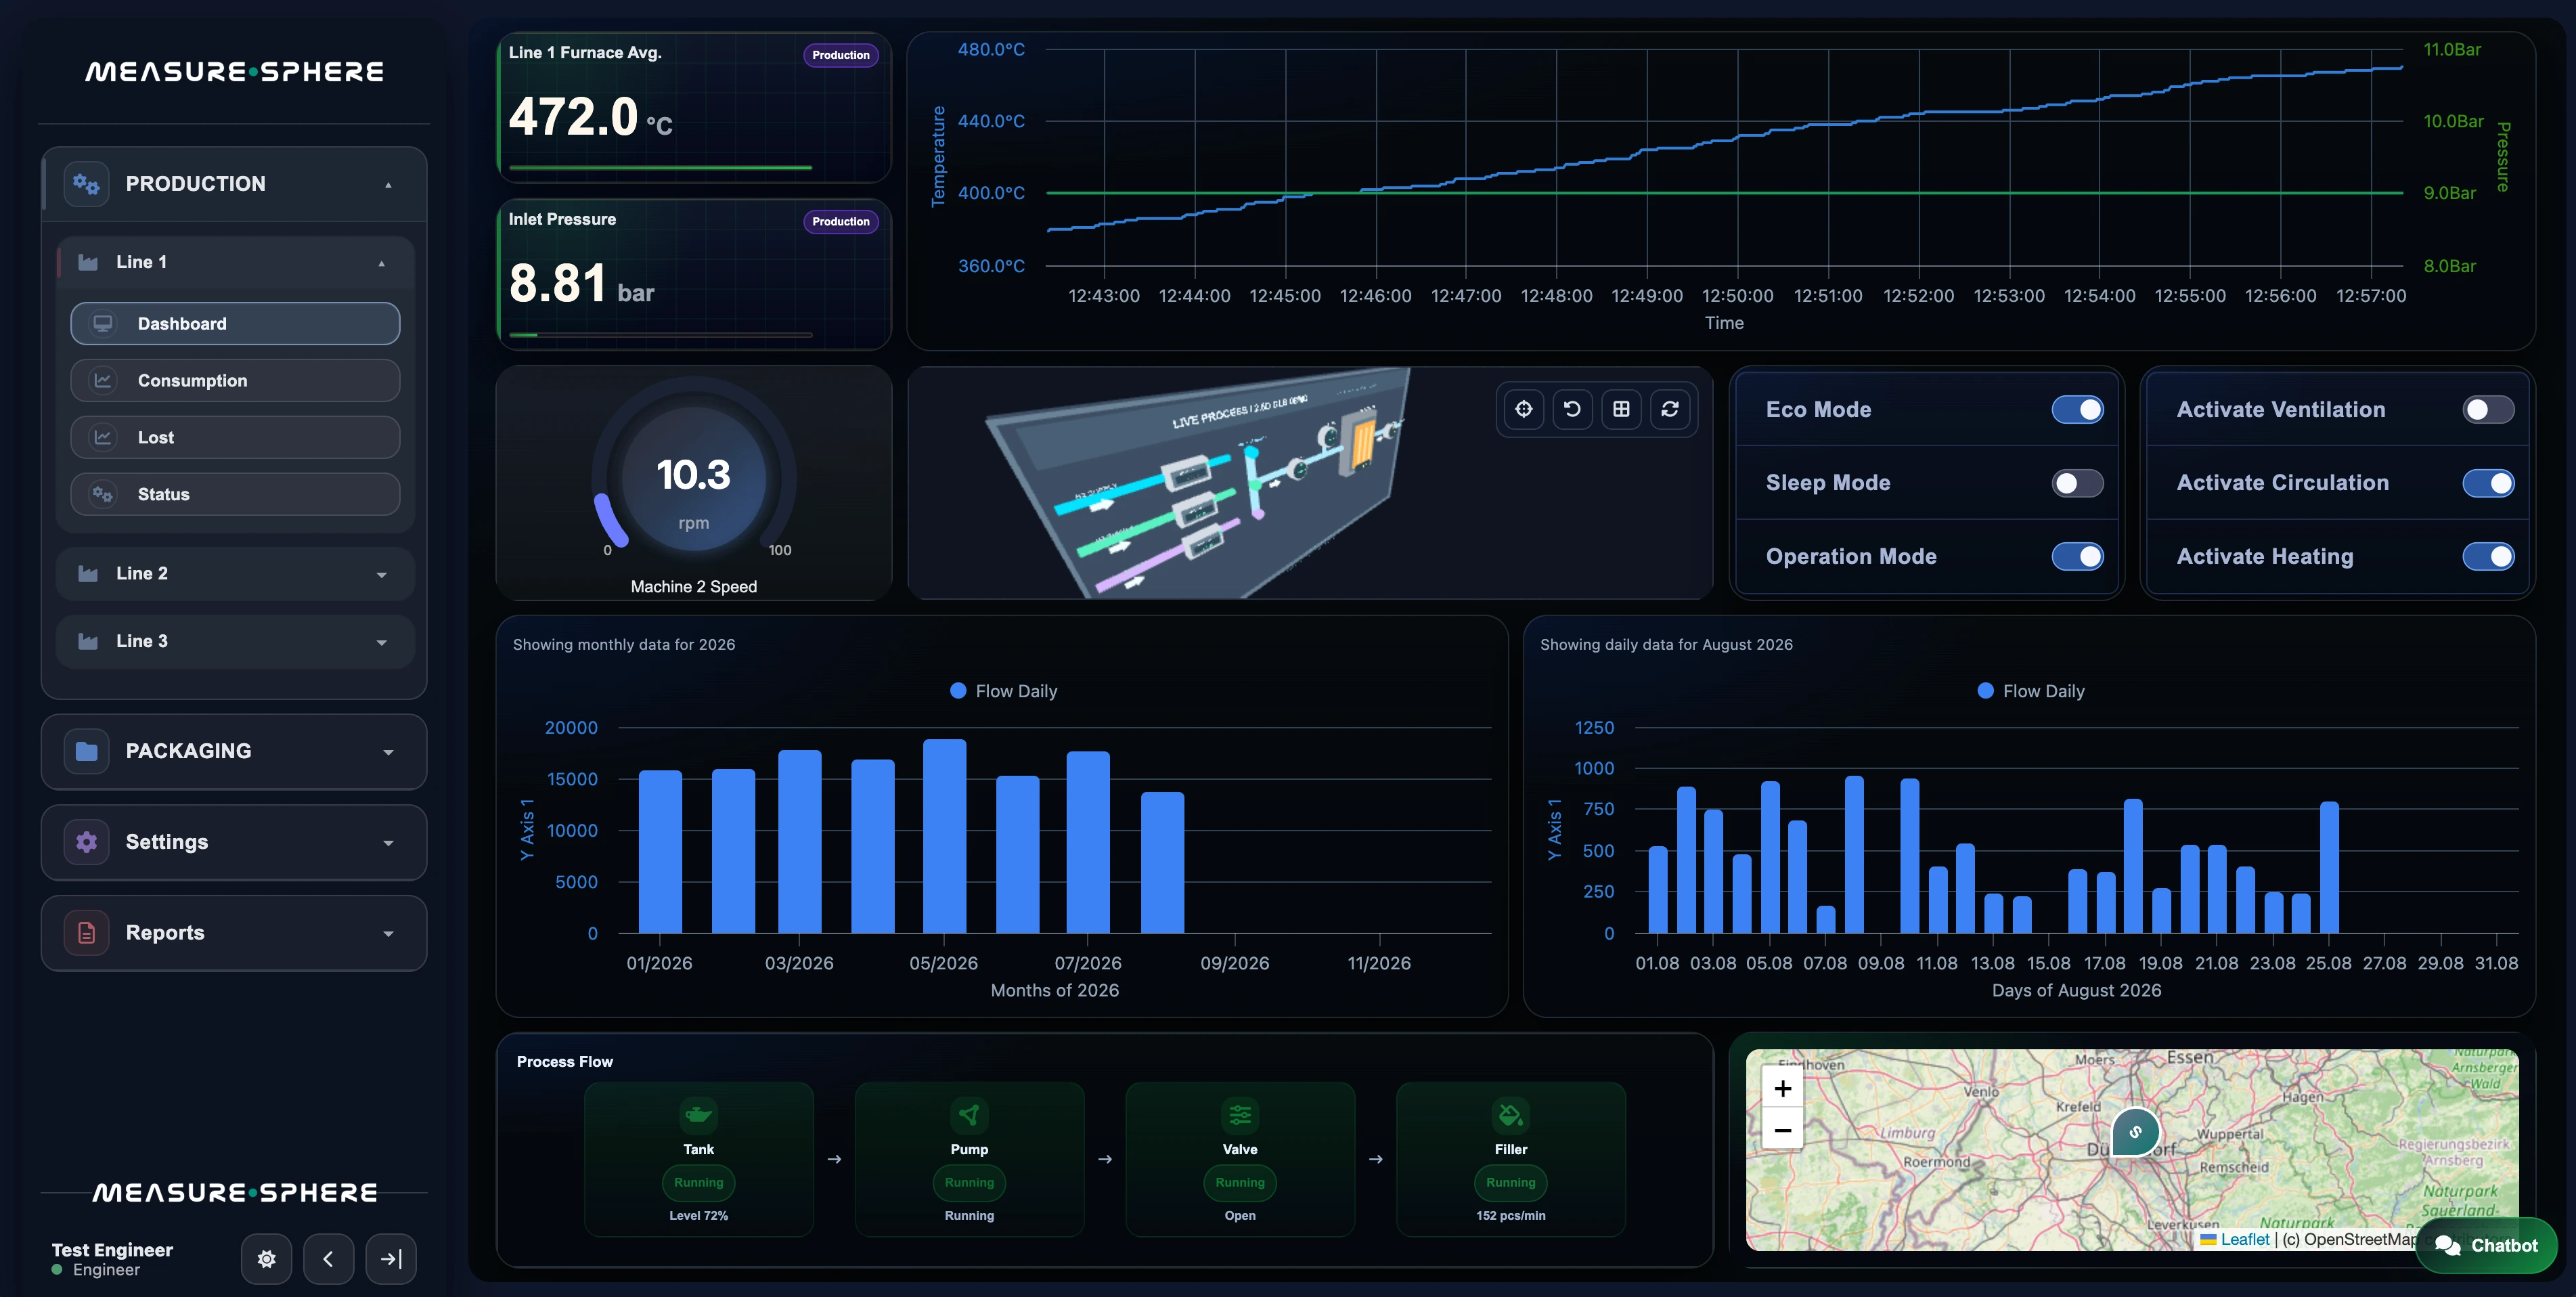
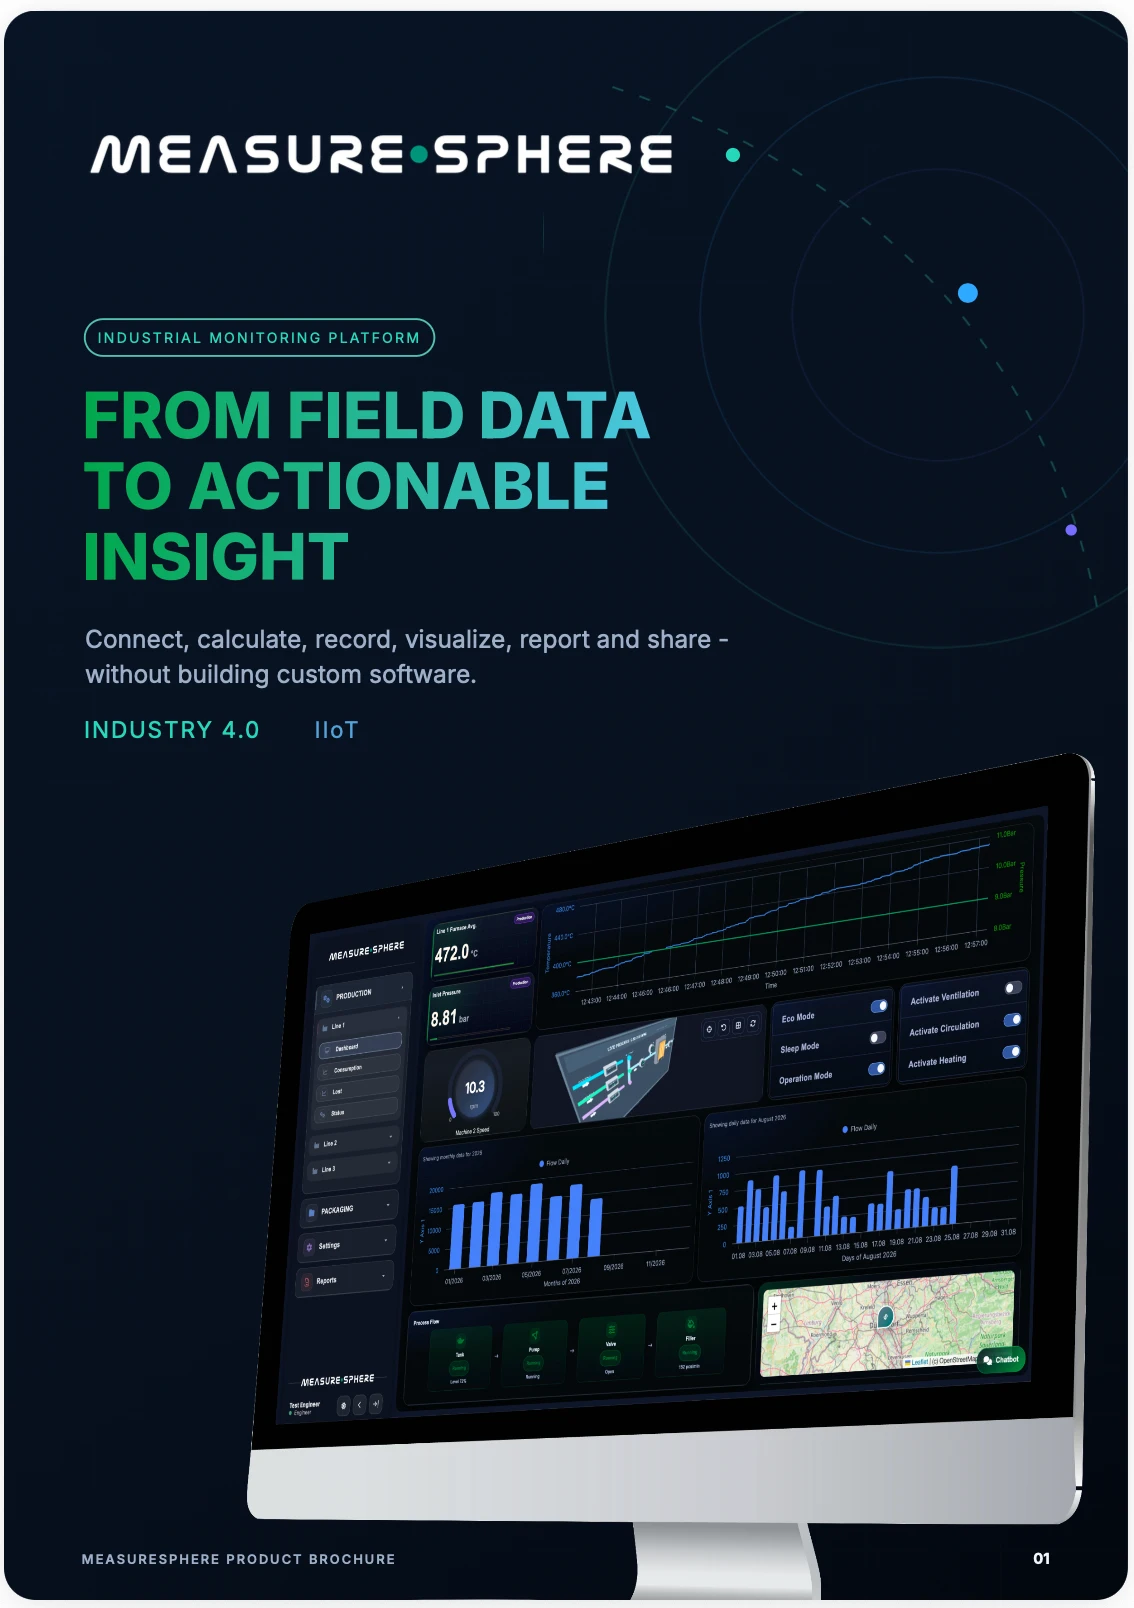
MeasureSphere main dashboard screen
What do you see on this screen? KPI cards, trend charts, process views, operational components, report-ready data and map-based visualizations come together within a single user experience.
PLATFORM FLOW
The approach that best describes MeasureSphere is: Connect → Calculate → Record → Visualize → Report → Share . In other words, the system does not just display data; it transforms data into a working application.
01
Connect
Add OPC UA, Modbus, Siemens S7, MQTT Client, REST Client and other data sources to the platform.
02
Calculate
Generate new virtual information using functions such as formulas, consumption, averages, status and OEE.
03
Record
Select the channels you want, define logging intervals and quickly create your historian infrastructure.
04
Visualize
Create dashboards, process screens, user pages, maps, 3D and other visualizations according to your needs.
05
Report
Turn data into information suitable for decision-making with trend, category, status, consumption and similar reports.
06
Share
Share the resulting data with other systems in real time via OPC UA Server or REST.
FROM RAW DATA TO NEW INFORMATION
Don't just collect data.
Generate new information.

Actual values coming from the field are often not sufficient on their own. MeasureSphere allows you to process data received from real channels with ready-to-use calculation functions and convert it into new virtual channels that you can use in your application.

Using ready-to-use functions such as average, cumulative value, formula, linearization, operating mode, OEE and similar functions, you can create calculations specific to your process without developing software.
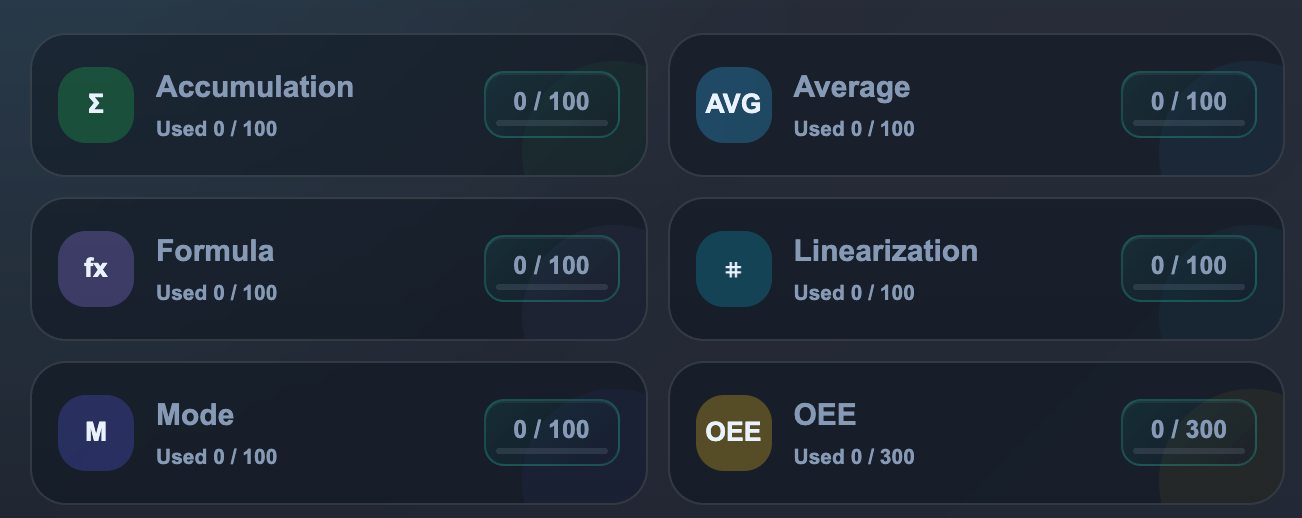
MeasureSphere calculation and function modules
01 — REAL CHANNELS
Get data from the field.
Use real-time values coming from sensors, PLCs, devices or other data sources.
02 — FUNCTIONS
Process the data.
Create your calculation, formula, average, accumulation, status or performance logic with ready-to-use modules.
03 — VIRTUAL CHANNELS
Use the new information.
Reuse the generated results in dashboards, logging, alarms, reports and other application components.
Result: instead of simply displaying raw process data on the screen, you can transform it into an application that generates new information specific to your process, such as consumption, performance, efficiency and status.
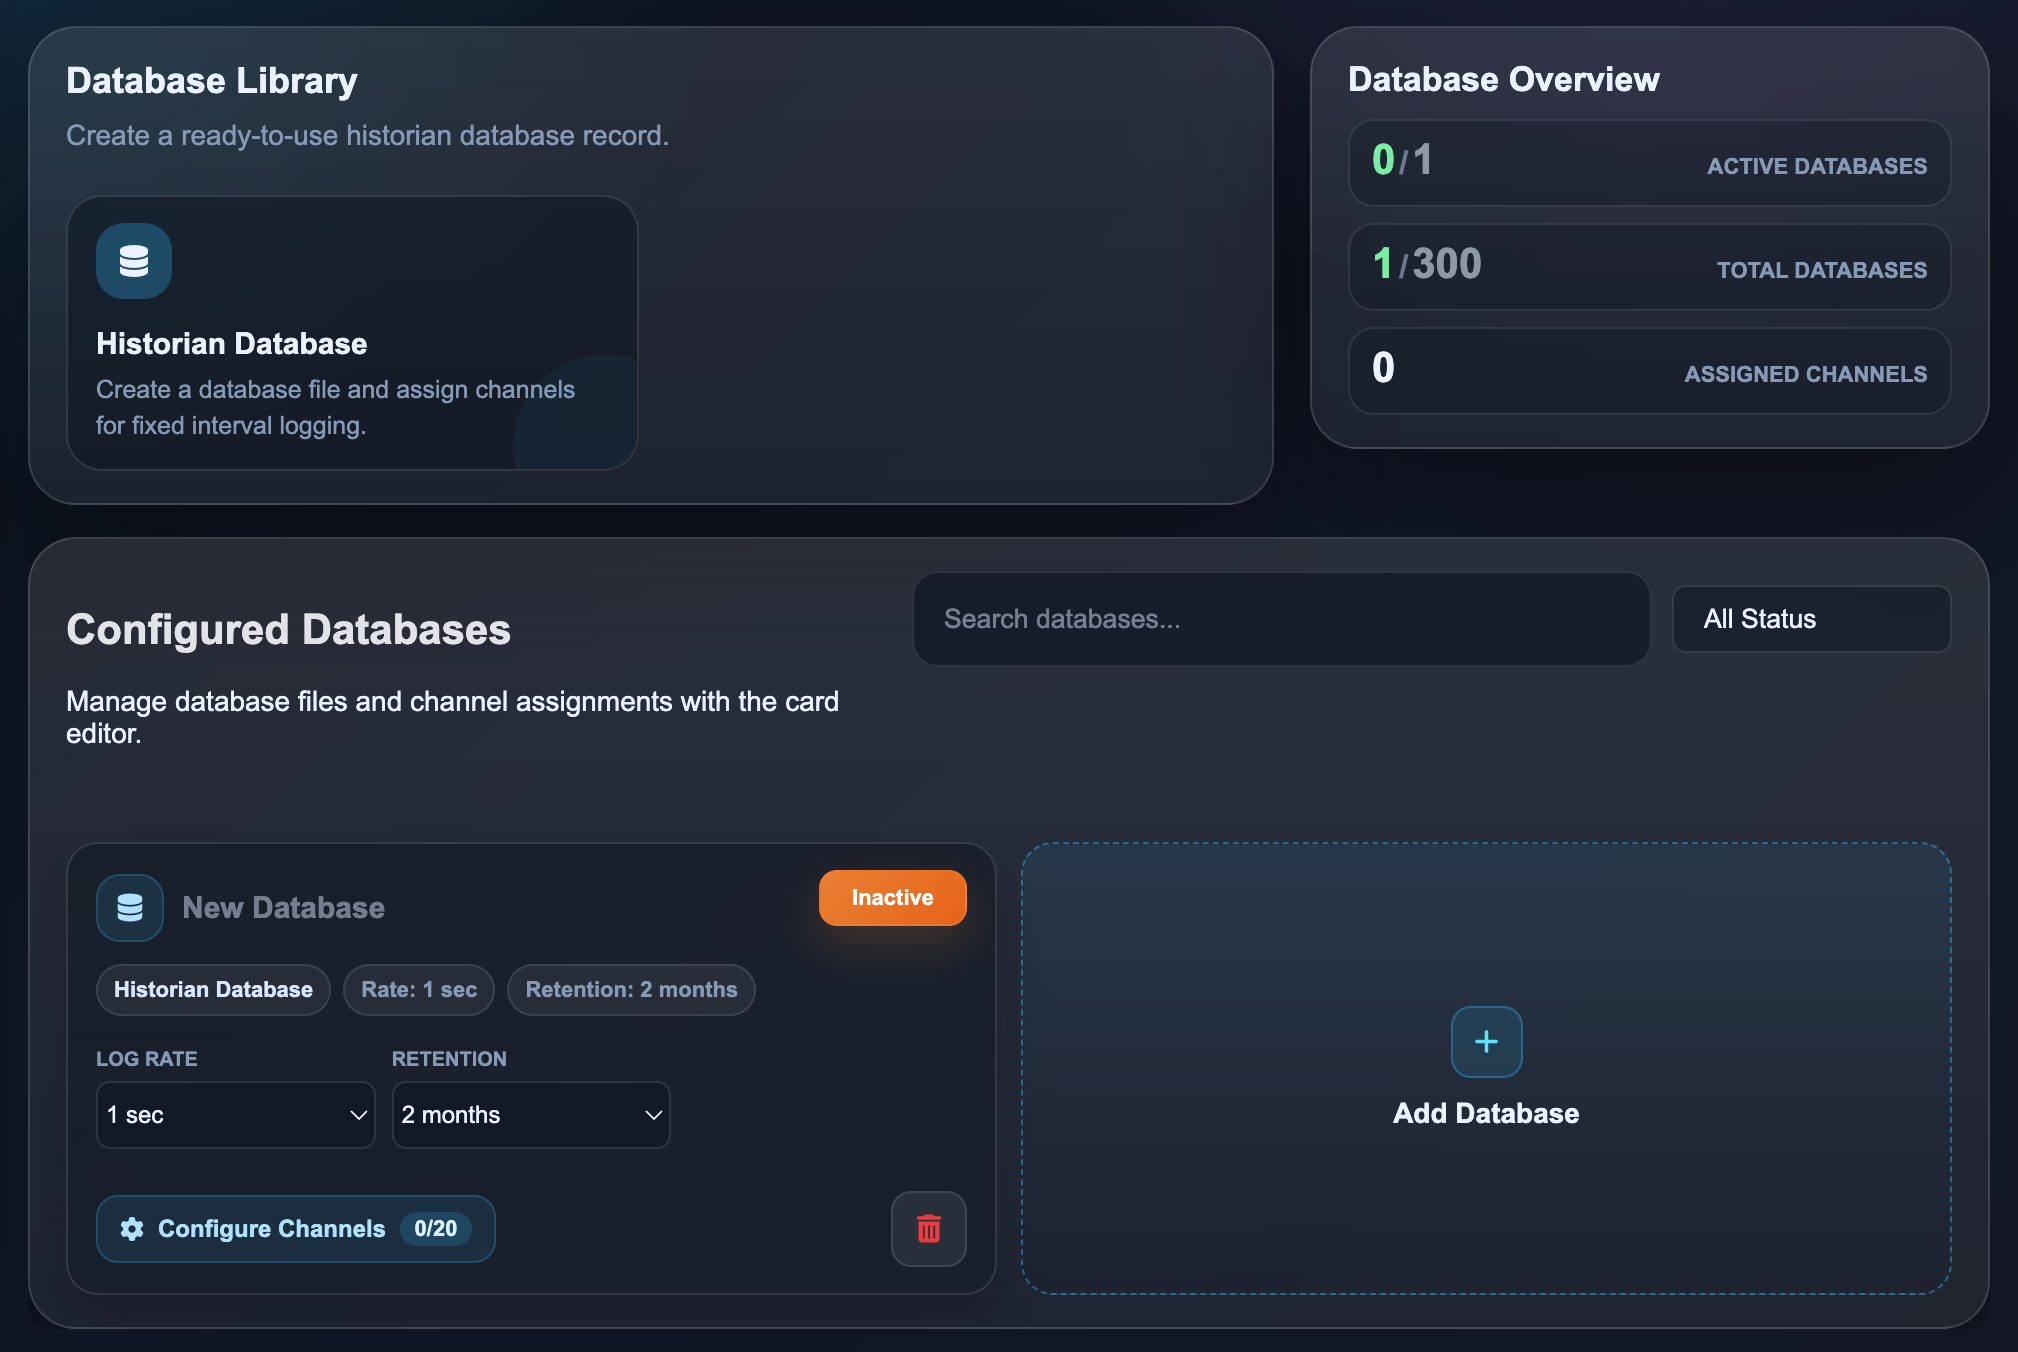
MeasureSphere Datalogging and Historian Database screen
READY-MADE LOGGING INFRASTRUCTURE
Do not lose your data.
Define the logging rule yourself.

With MeasureSphere, you do not have to develop separate datalogger software or prepare the database structure from scratch for each project in order to build a logging infrastructure.

Select the channels to be logged, define the logging interval and retention period. Create independent Historian Database records for different needs.

01 — DATABASE
Create the log.
Define a Historian Database specific to your needs.
02 — CHANNELS
Select the channels.
Log only the real or virtual channels you need.
03 — LOG RATE
Define the logging interval.
Use different intervals, from fast processes to long-term consumption data.
04 — RETENTION
Select the retention period.
Define a data retention period suitable for each log group.
Use different logging strategies in the same project
PROCESS
1 second
Fast-changing production data
ENERGY
15 minutes
Long-term consumption analysis
PRODUCTION
1 minute
Performance and production history
Different data, different rules. MeasureSphere allows you to create independent archives within the same system with different logging intervals and retention periods.
CREATE YOUR OWN SCREEN
Do not try to adapt to a ready-made screen.
Design the screen according to your needs.

With MeasureSphere, you can create your dashboard and operation screens according to your process, users and the information you want to display.

Define the page layout, create screen areas and place the components you need. Create different user experiences, from simple KPI screens to process views and management dashboards.
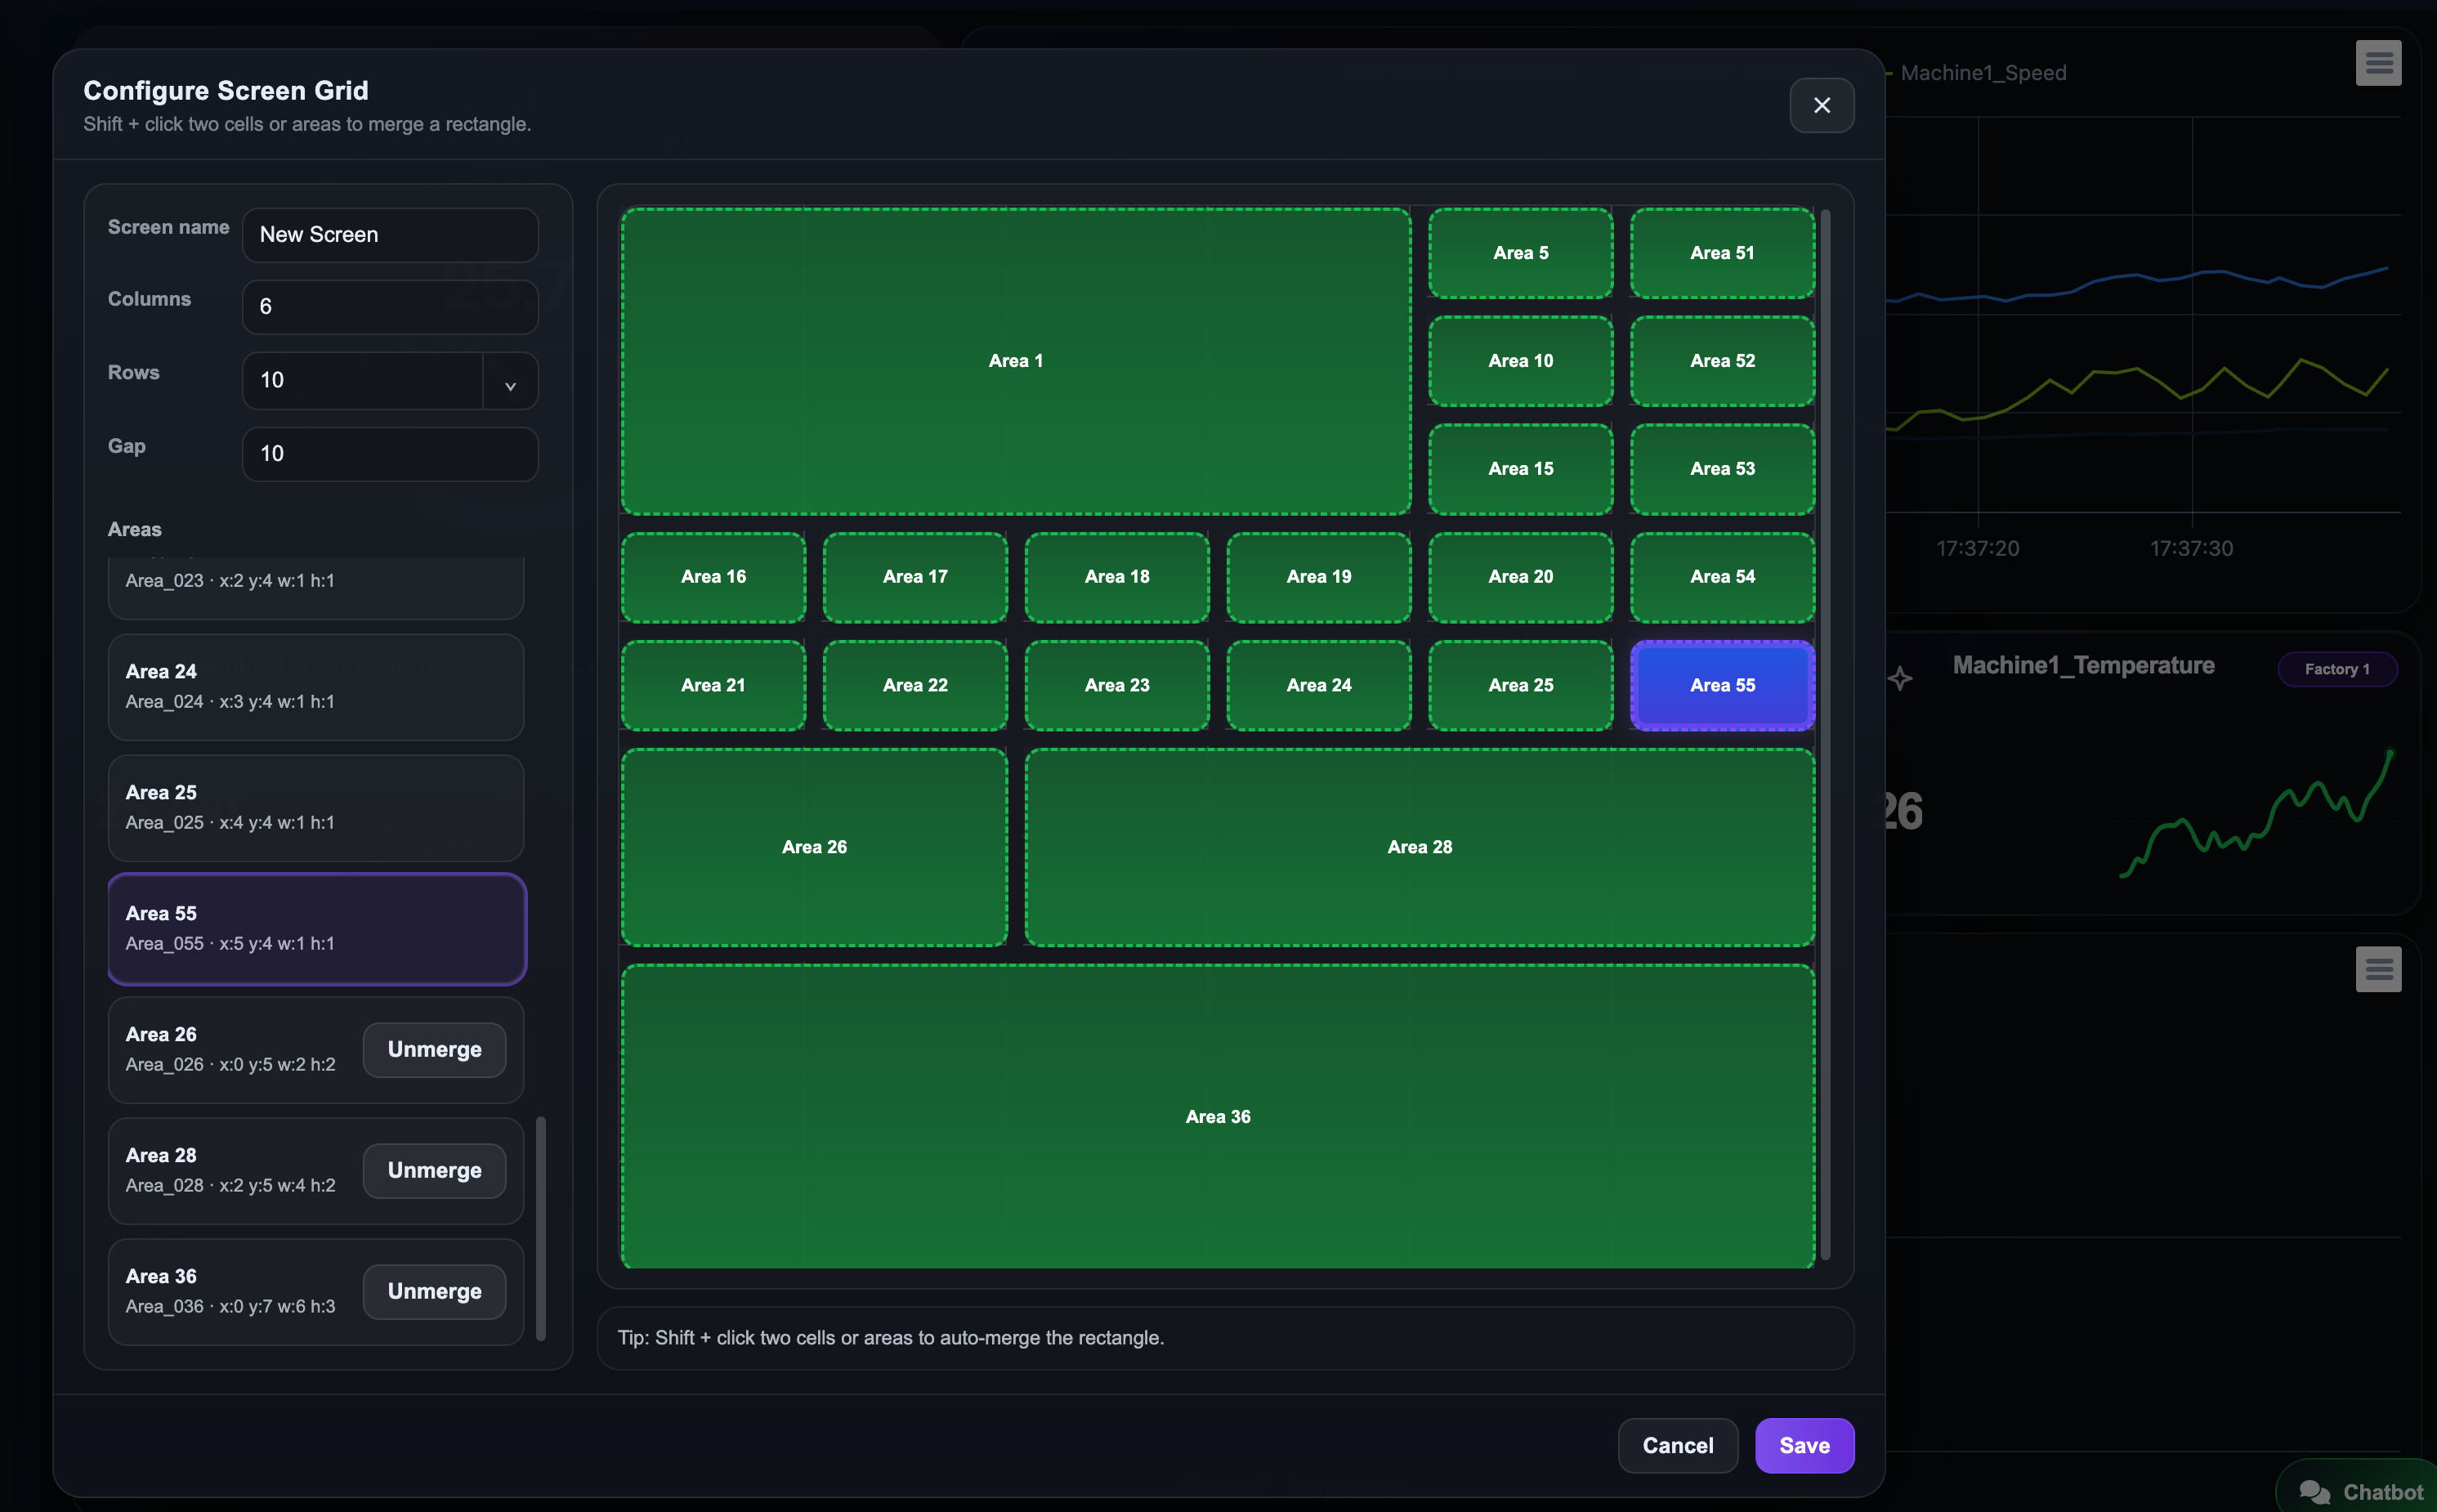
The screen is yours. Instead of being limited to a ready-made interface, create the user screens your operation needs.
MeasureSphere screen design and Screen Grid interface
GRID
Create the layout.
Define rows, columns and screen areas according to your needs.
COMPONENTS
Add the content.
Use chart, value, status and process components.
TEMPLATES
Reuse them.
Reuse the structures you create in similar applications.
RESPONSIVE
Adapt to different screens.
Use web screens across different devices and resolutions.
Do not limit yourself to a single type of visualization.
Dashboard
Process View
Maps
3D
SEE YOUR DATA FROM DIFFERENT PERSPECTIVES
Do not limit yourself to dashboards.
View the field on maps and in 3D.

In addition to traditional dashboards and process screens, MeasureSphere also allows you to create location-based applications and interactive 3D visualizations. You can monitor different facilities, equipment or processes within the visual structure that best suits your needs.
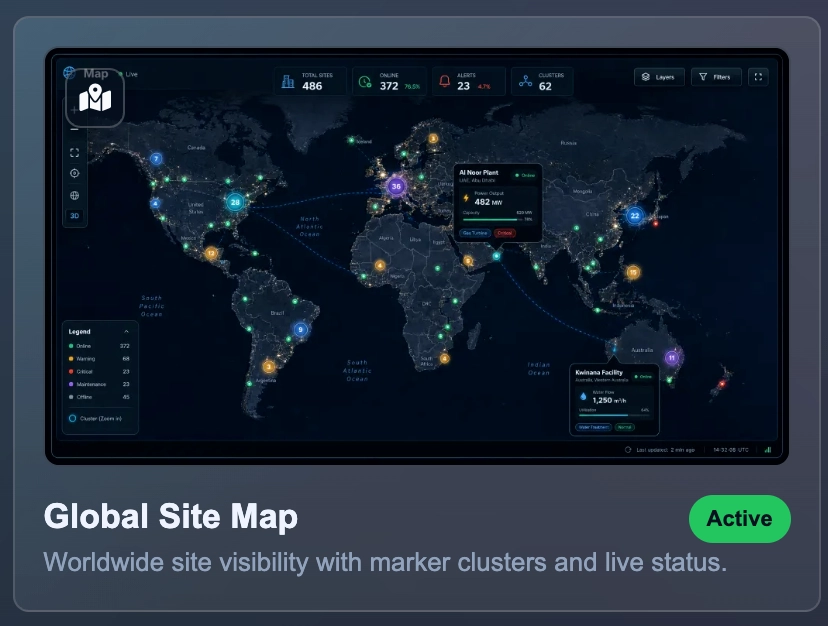
MeasureSphere Maps location-based visualization
MAPS
Monitor data together with its location.
Position facilities, stations or equipment at different locations on a map; view status and measurement information within a geographical context.
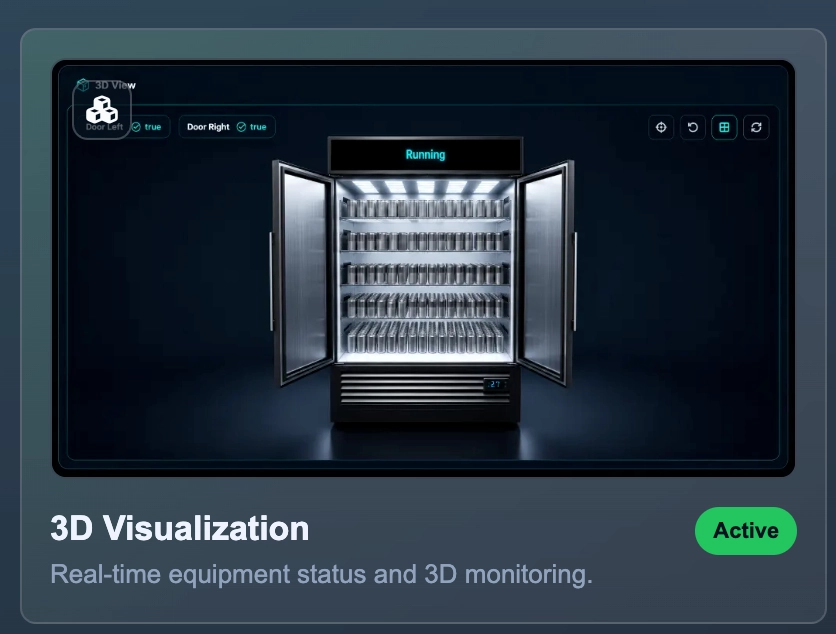
MeasureSphere interactive 3D visualization
INTERACTIVE 3D
View your process in three dimensions.
Visualize machines, production lines or facility structures in a 3D environment; create more powerful operational screens by associating real-time data with physical equipment.
Dashboard
Process View
Maps
Interactive 3D
Same data, different perspective. Choose the visualization method that is most meaningful for your operation; use real-time data within dashboards, process views, maps or 3D environments.
FROM DATA TO DECISION
Logging data is not enough.
Analyze and report it.

MeasureSphere allows you to analyze your recorded process and production data using ready-to-use report structures. Compare different time periods, examine trends and reach meaningful conclusions for your operation.

With different report types such as trend, channel, category, state distribution and consumption, you can create outputs that can be used for both technical analysis and management-level evaluation.
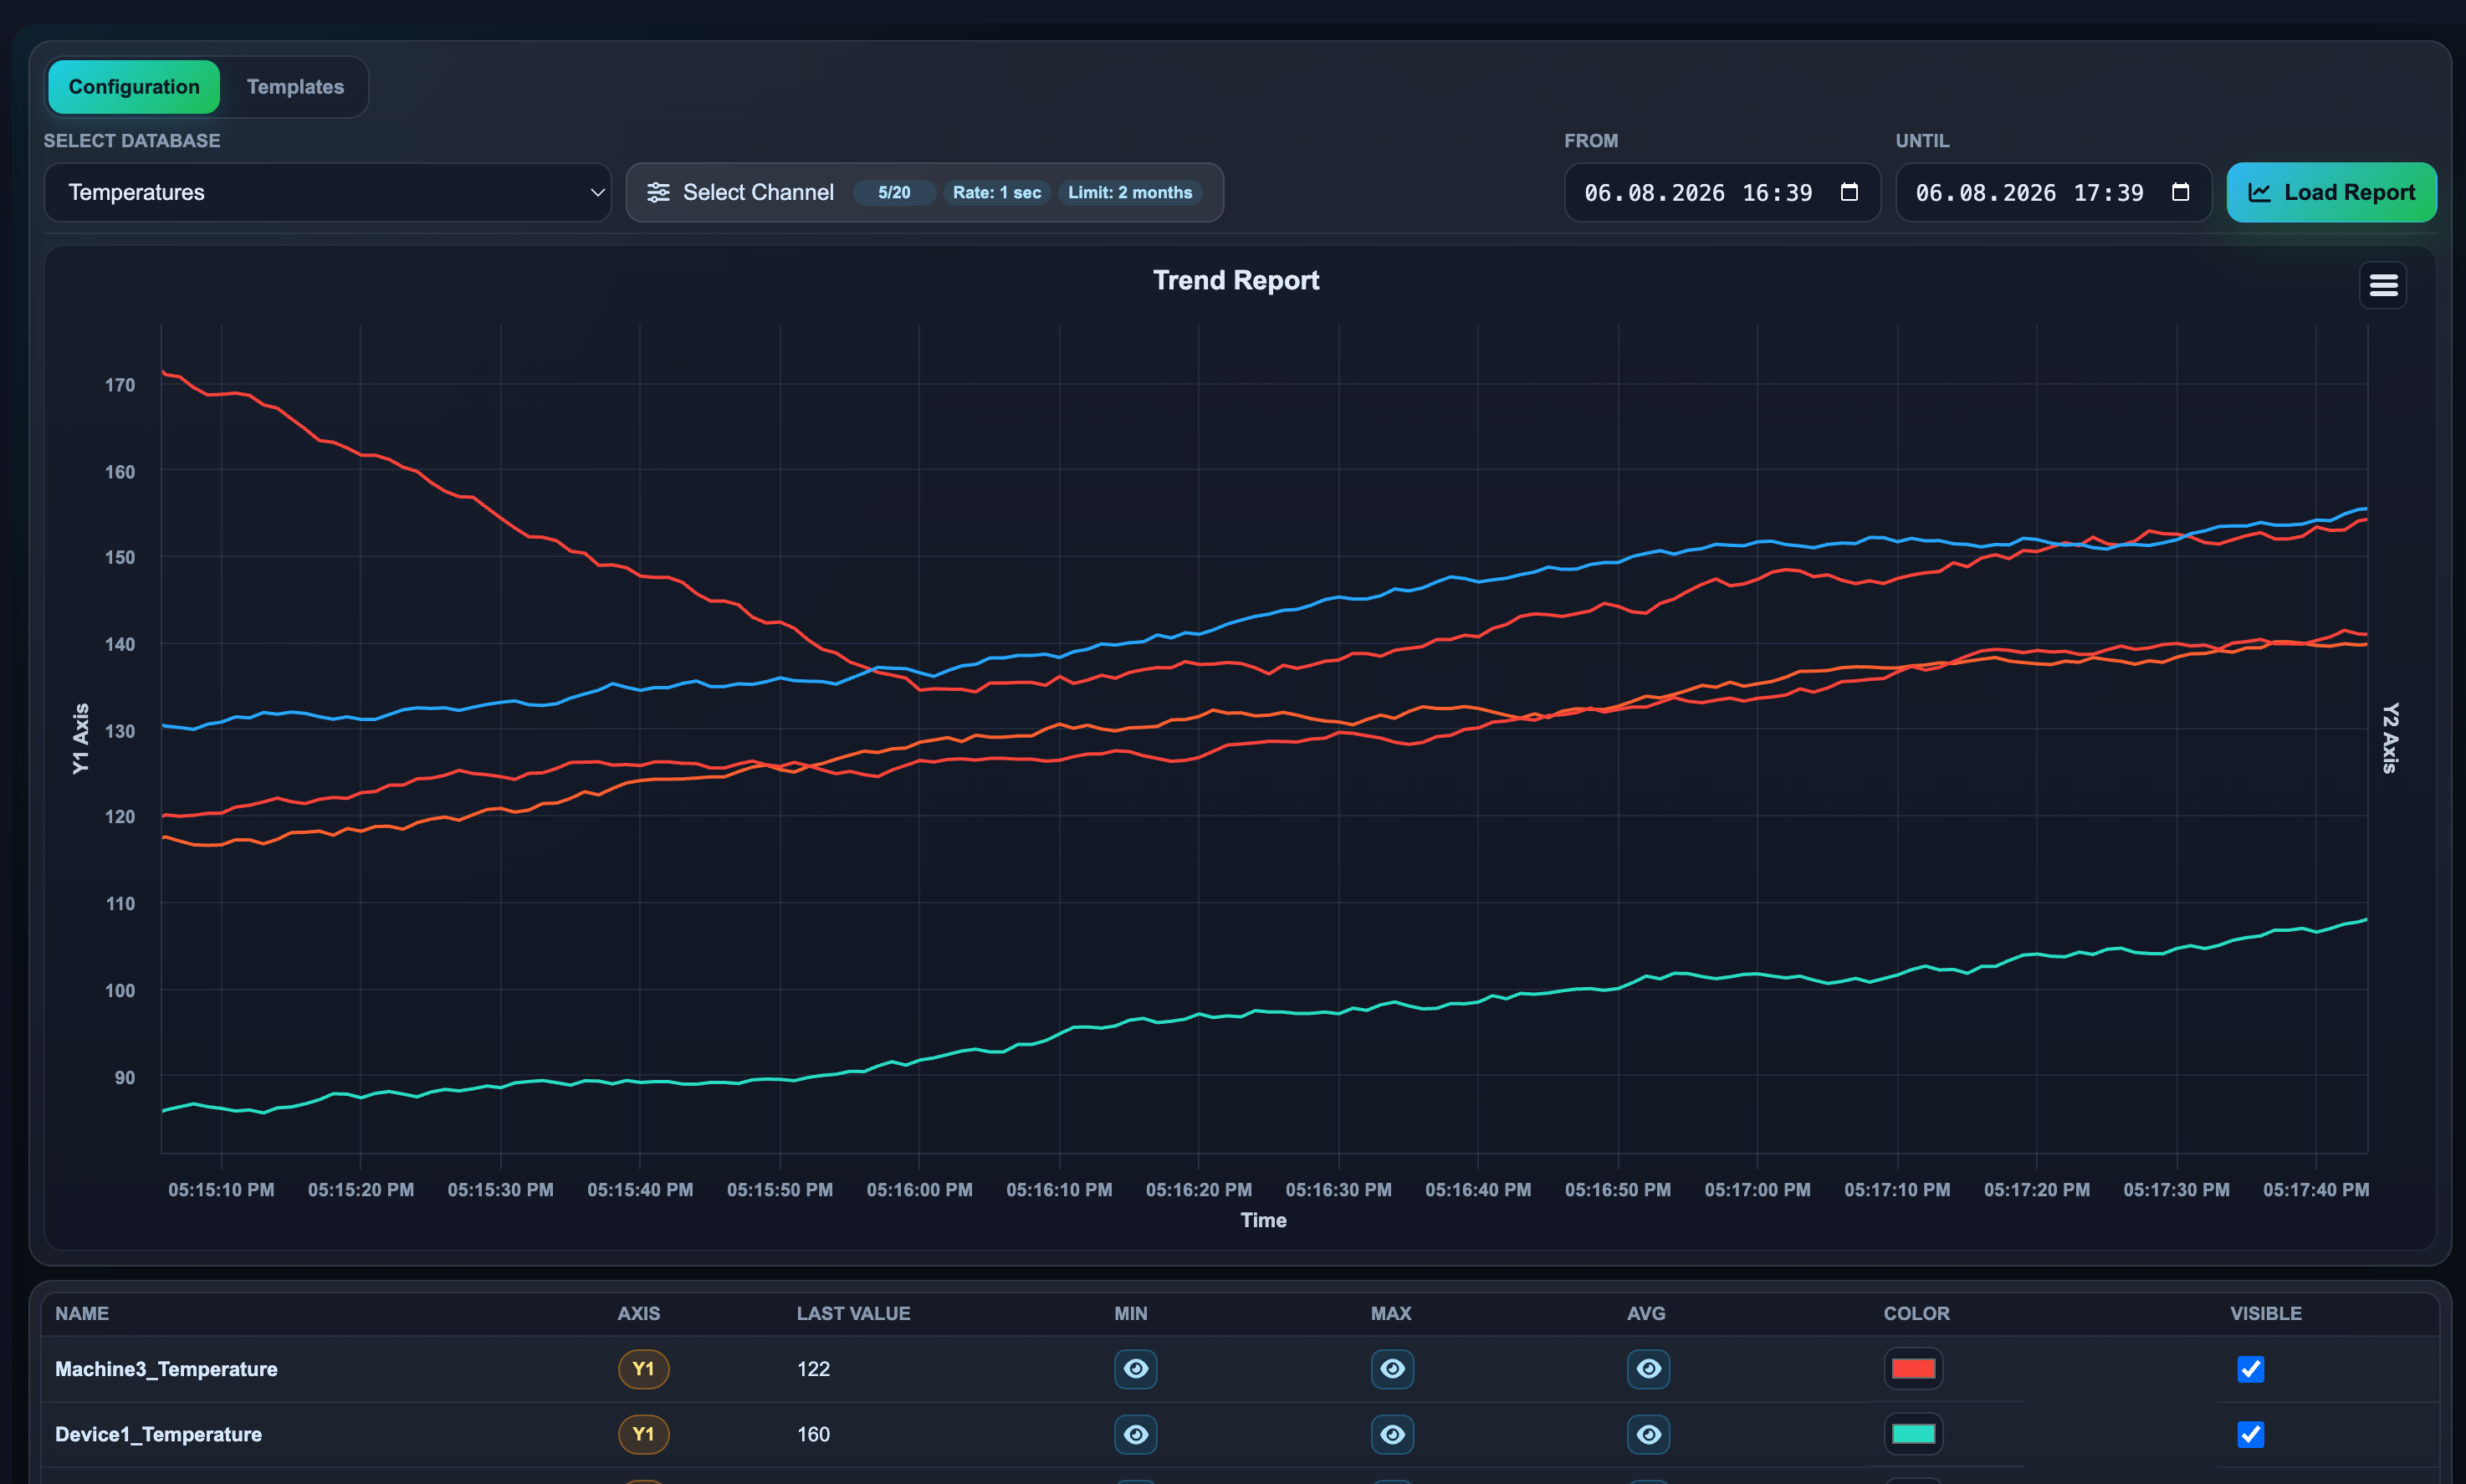
Same data, different analysis. Evaluate your data from different perspectives by selecting the report type and time range according to your needs.
MeasureSphere reporting and trend analysis screen
Choose the report that suits your needs
TREND
See changes over time.
Examine changes in multiple data points on the same time axis.
CHANNEL TREND
Focus on a single channel.
Analyze the historical performance of a specific channel in detail.
CATEGORY
Compare categories.
Evaluate grouped data comparatively.
STATE
See the state distribution.
Analyze the durations of operating, waiting and similar states.
CONSUMPTION
Analyze consumption.
Report energy, water, gas and similar consumption data.
Use the results outside the platform as well.
Export the reports and analysis results you create when needed and use them in different working and sharing processes.
EXPORT
Excel
CSV
JPG
DEPLOYMENT MODEL THAT SUITS YOUR NEEDS
One platform.
Two deployment models.

You can use MeasureSphere on the ready-to-use Web Platform or as an On-Premise solution within your own server and network infrastructure, depending on your needs. The application logic remains the same; you only decide where the platform will run.

MEASURESPHERE WEB PLATFORM
FACTORY
OFFICE
MOBILE
WEB PLATFORM
Get started without setting up the infrastructure.
Use MeasureSphere on the ready-hosted platform. Build your application without preparing server infrastructure and access it through a web browser.
Quick start
Hosted platform
Web-based access
Subscription model
PLC
SENSOR
DEVICE
YOUR SERVER
MEASURESPHERE
YOUR NETWORK · YOUR INFRASTRUCTURE
ON-PREMISE
Run the platform on your own infrastructure.
Install MeasureSphere on your own server and corporate network. Keep the data and application infrastructure within your facility and use it through the local or corporate network via a web-based interface.
Your own server
Your own network infrastructure
Local data infrastructure
Web-based use
Same MeasureSphere. Different infrastructure choice. Choose the appropriate deployment model according to your project's security, IT, access and operational requirements.
OPERATION LAYER
Do not just monitor.
Manage and share the system.

MeasureSphere brings together the essential functions required for the daily operation of the application within the same platform, from user access and alarm management to system backups and data sharing with other software.

 
USERS & PERMISSIONS
Give each user the access they need.
Create users and groups, and manage access rights according to the organizational structure of your application.
User management
User groups
Authorization
 
ALARMS & NOTIFICATIONS
Stay informed about important changes.
Define alarm conditions for process or application values and notify the relevant users when these conditions occur.
Alarm management
Email notifications
Optional SMS via external API
 
INTEGRATION
Do not keep the data locked inside the platform.
Share collected or calculated information with other applications and automation systems when needed.
OPC UA Server (optional)
REST Server (optional)
Data sharing with other systems
Protect and transfer your application.
Back up your system and project configurations; support operational continuity by exporting or re-importing configurations when needed.
BACKUP
Backup
EXPORT
Export
IMPORT
Import
One application, controlled access and open data flow. Manage daily operational needs from users and alarms to backups and integrations through the same platform.
TWO DIFFERENT NEEDS, ONE PLATFORM
For your facility.
And for your customer's project.

MeasureSphere provides the same ready-made infrastructure both to industrial companies that want to create digital applications in their own facilities and to system integrators and automation companies that develop projects for their customers.

 
FACTORIES & FACILITIES
Build the system you have in mind according to your own needs.
Without starting a software project, create the monitoring, calculation, logging and reporting applications you need in your facility on MeasureSphere.
Monitor energy consumption
Calculate machine and production performance
Create OEE and virtual KPIs
Define alarms and notifications
Create dashboards and process screens
Create reports
 
SYSTEM INTEGRATORS & AUTOMATION COMPANIES
Do not redevelop the infrastructure for every project.
Use the data acquisition, channel management, calculation, logging, user access, alarm, screen and reporting infrastructure ready-made. Focus on your customer's solution.
Ready-made data acquisition infrastructure
Ready-made calculation and virtual channel infrastructure
Ready-made datalogging and historian
Ready-made user and alarm infrastructure
Ready-made dashboard and reporting tools
Reusable project structure
Spend your time on the application, not the infrastructure.
Shorten development time. Commission the project faster. Move on to the next requirement or the next project.


YOUR DATA. YOUR LOGIC. YOUR SCREENS.
Collect your data. Generate the information you need. Log, visualize, report and share it.
Instead of trying to adapt to the limitations of ready-made software, build the Industry 4.0 application you need on MeasureSphere.
 
INDUSTRIAL MONITORING · IIoT · INDUSTRY 4.0
MeasureSphere PDF Brochure
PRODUCT BROCHURE
Explore MeasureSphere features in more detail.
You can review the core features of MeasureSphere in the product brochure, from data connectivity and calculations to datalogging, screen design, reporting, and Web Platform and On-Premise deployment options.
Open / Download PDF Brochure
MeasureSphere Industrial Monitoring Platform
GROWS WITH YOUR PROJECT
Start with what you need.
Expand as your project grows.

MeasureSphere's licensing structure is designed to adapt to different scales, from a small data acquisition application to more comprehensive Industry 4.0 and IIoT projects. Start with the resource and channel capacity you need; expand the system as your application grows.

01
DATA SOURCES
How many sources will you collect data from?
Add PLCs, devices, gateways or other data sources to the platform according to the scope of your project.
02
REAL CHANNELS
How many real values will you monitor?
Scale temperature, pressure, energy, meter, status or production values received directly from the field according to your needs.
03
VIRTUAL CHANNELS
How much new information will you generate?
Define the virtual channel capacity created through formulas, consumption, performance, OEE and other calculations according to your project.
Same platform, different project scales
START
Single machine or process
Get started quickly with a limited number of data sources and channels.
GROWING PROJECT
Line or department
Add more data sources, real channels and calculations.
LARGE SCALE
Facility or multiple applications
Scale to broader IIoT and Industry 4.0 applications.
Same licensing logic, different applications
Industry 4.0
IIoT
OEE
Consumption
Test & Measurement
Start small, grow on the same platform. Instead of purchasing capacity you do not need for the first project, start with a structure that matches the actual scope of your application and scale as new data sources, channels and calculations are added.

MeasureSphere hakkında sık sorulan soruların yanıtlarını aşağıda bulabilirsiniz. Projenize özel bir konu için bizimle iletişime geçebilirsiniz.

     MeasureSphere hangi sistemlerden ve protokollerden veri alabilir?
MeasureSphere; OPC UA, Modbus TCP/IP, Siemens S7, MQTT ve desteklenen diğer endüstriyel veri kaynaklarından gerçek zamanlı veri alabilir. Platforma eklenen kanallar daha sonra hesaplama, kayıt, alarm, dashboard ve raporlama işlemlerinde kullanılabilir.
Veri kaydı için ayrıca SQL veritabanı veya özel bir datalogger yazılımı geliştirmem gerekir mi?
Hayır. MeasureSphere içerisinde kayıt altına alınacak gerçek veya sanal kanalları seçebilir, kayıt periyodunu ve saklama süresini belirleyebilir ve farklı ihtiyaçlar için birbirinden bağımsız arşivler oluşturabilirsiniz.
SORUNUZ BURAYA
Cevabınızı buraya yazabilirsiniz.
Demo software downloads will be activated by filling out the form.
Now you can download the following software suitable for you. After clicking the button, the download link of the software will be sent to your e-mail address.
WhatsApp
×
Demo of this product is available.

You can download the free demo to try this product. To access the download form click.